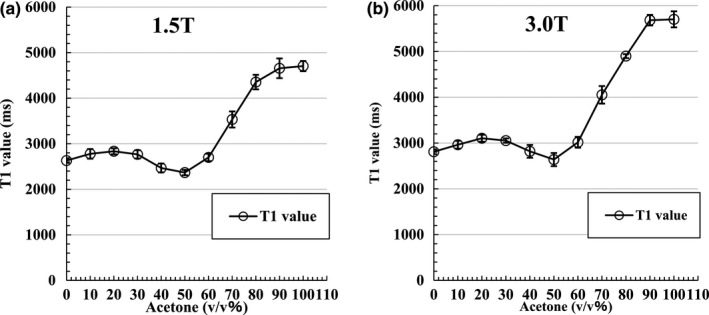
Figure 3.

Measurement result of T1 value at acetone dilution. (a) Graph of T1 value by 1.5 T acetone dilution at 24°C ± 1°C. The T1 value is longer than that of PW when the acetone dilution is higher than 60 v/v%. The vertical lines and whiskers indicate the standard deviation; (b) graph of T1 value at 3.0 T with the acetone dilution at 24°C ± 1°C. The T1 value is longer than that of PW when the acetone dilution is higher than 60 v/v%. Vertical lines and whiskers show the standard deviation. Measurement points are connected by straight lines, not fitted curves.
