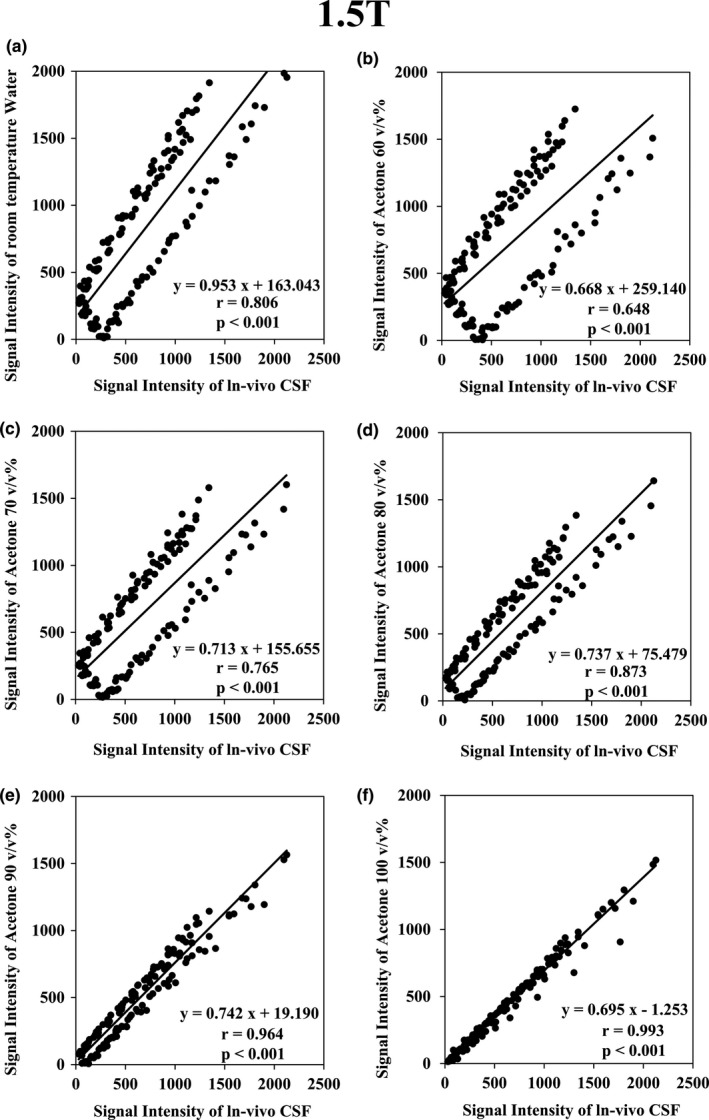
Figure 4.

Graph of the Spearman rank correlation coefficient test results at 1.5 T. (a) Between in‐vivo cerebrospinal fluid (CSF) and purified water (r = 0.806; P < 0.001); (b) between in‐vivo CSF and acetone 60 v/v% (r = 0.648; P < 0.001); (c) between in‐vivo CSF and acetone 70 v/v% (r = 0.765; P < 0.001); (d) between in‐vivo CSF and acetone 80 v/v% (r = 0.873; P < 0.001); (e) between in‐vivo CSF and acetone 90 v/v% (r = 0.964; P < 0.001); f: Between in‐vivo CSF and acetone 100 v/v% (r = 0.993; P < 0.001).
