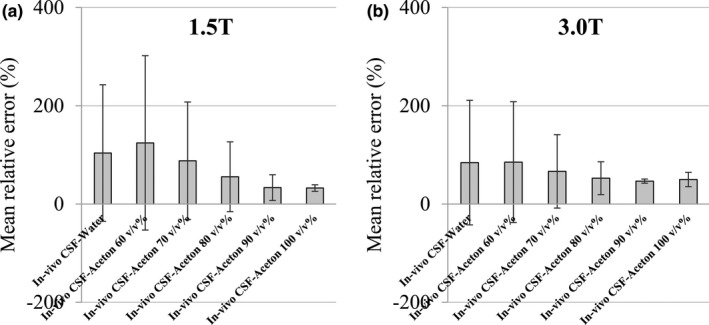
Figure 7.

Average relative error of pure water and acetone 60–100 v/v% based on in‐vivo cerebrospinal fluid (CSF). The vertical axis is the average relative error and the horizontal axis is the sample concentration based on the in‐vivo CSF. Vertical lines and whiskers show the standard deviation. (a) Result at 1.5 T. (b) Result at 3.0 T.
