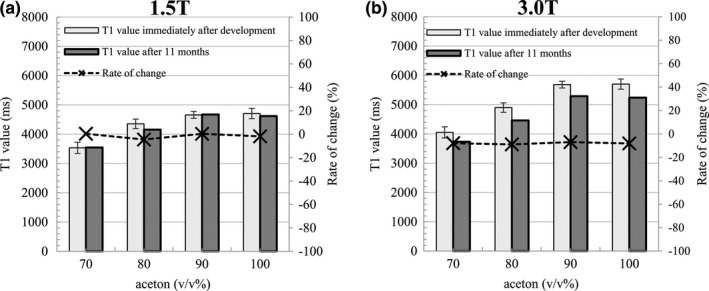
Figure 8.

T1 value of acetone 70–100 v/v% obtained approximately 11 months after development. The left vertical axis shows the T1 value and the horizontal axis shows the acetone concentration. The right vertical axis corresponds to the dotted line in the rate of change. Vertical lines and whiskers show the standard deviation. (a) Result at 1.5 T. (b) Result at 3.0 T.
