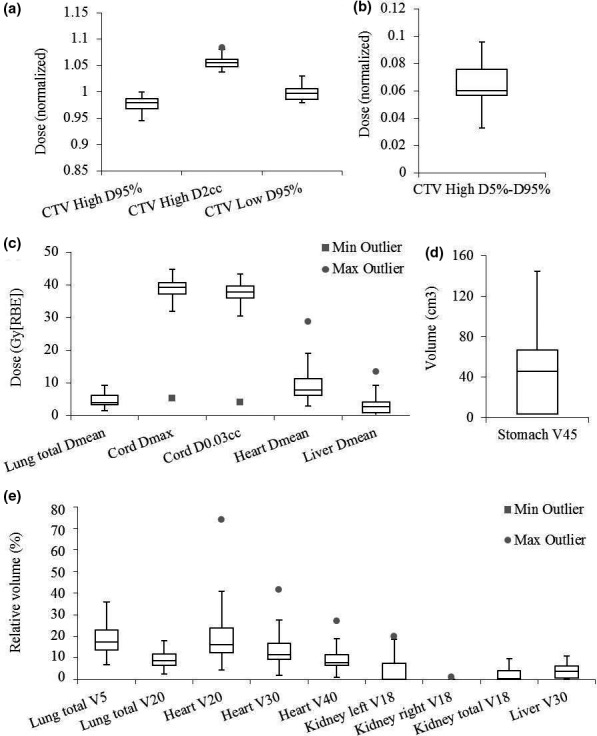
Figure 5.

Interplay effects evaluation in intensity‐modulated proton therapy (IMPT) using the dose–volume histogram indices with interplay effects considered, including (a) clinical target volume (CTVhigh) D95% and, and CTVlow D95% normalized to the prescription dose. (b) CTVhigh D5%‐D95% normalized to the prescription dose. (c) Lung Dmean, cord Dmax and , heart Dmean, and liver Dmean in absolute dose. (d) Stomach V45Gy[RBE] in absolute volume. (e) Lung V5Gy[RBE] and V20Gy[RBE], heart V20Gy[RBE], V30Gy[RBE] and V40Gy[RBE], left, right, and total kidneys V18Gy[RBE], and liver V30Gy[RBE] in relative volume. In each box plot, the five horizontal lines from top to bottom are the maximum, third quartile, median, first quartile, and minimum value of the corresponding DVH index for the whole group excluding the outliers respectively. The grey points are the outliers as defined in Statistical Analysis subsection. The blue boxes are the IMPT results and white boxes are the VMAT results. At our clinics it is required to have CTV D95% is at least 95% of the prescription dose for targets and the cord Dmax < 45 Gy[RBE] under the influence of interplay effects. Abbreviations: RBE = relative biological effectiveness.
