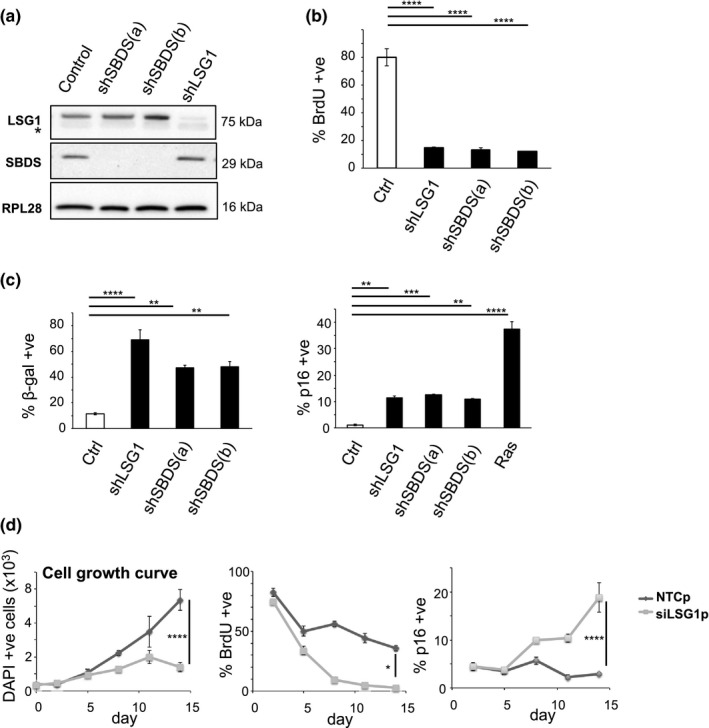
Figure 2.

Knockdown of LSG1 and SBDS induces senescence. (a) Western blot showing the efficiency of LSG1 and SBDS knockdown in MRC5 cells induced by the hairpins shLSG1, shSBDS(a) and shSBDS(b). The asterisk denotes a nonspecific band in the LSG1 blot. RPL28 was used as a reference protein. (b) High content imaging analysis of BrdU incorporation and immunostaining in MRC5 cells with LSG1 and SBDS downregulation, 7 days postinfection. The cells were treated with 50 mM BrdU for 16 hr. (c) The senescence‐associated β‐galactosidase assay was performed 7 days postinfection. Images were taken using phase contrast microscopy, and the number of cells that were positive for the blue precipitate was counted. The bar chart on the right shows high content imaging analysis of p16 immunostaining. Ras‐transduced cells were used as a positive control for p16 induction. (d) Time course experiment (time points: d0, d2, d5, d8, d11, d14) using a siRNA SMARTpool for LSG1 (siLSG1p). Cell growth (DAPI stain), BrdU incorporation and p16 expression were monitored throughout the time course using high content microscopy. Error bars show standard deviation of 3 biological replicates. Statistical significance was calculated using one‐way ANOVA with Dunnett's (Figure 2b,c) or Sidak's (Figure 2d) multiple comparisons tests. *p < 0.05, **p < 0.01, ***p < 0.001, and ****p < 0.0001
