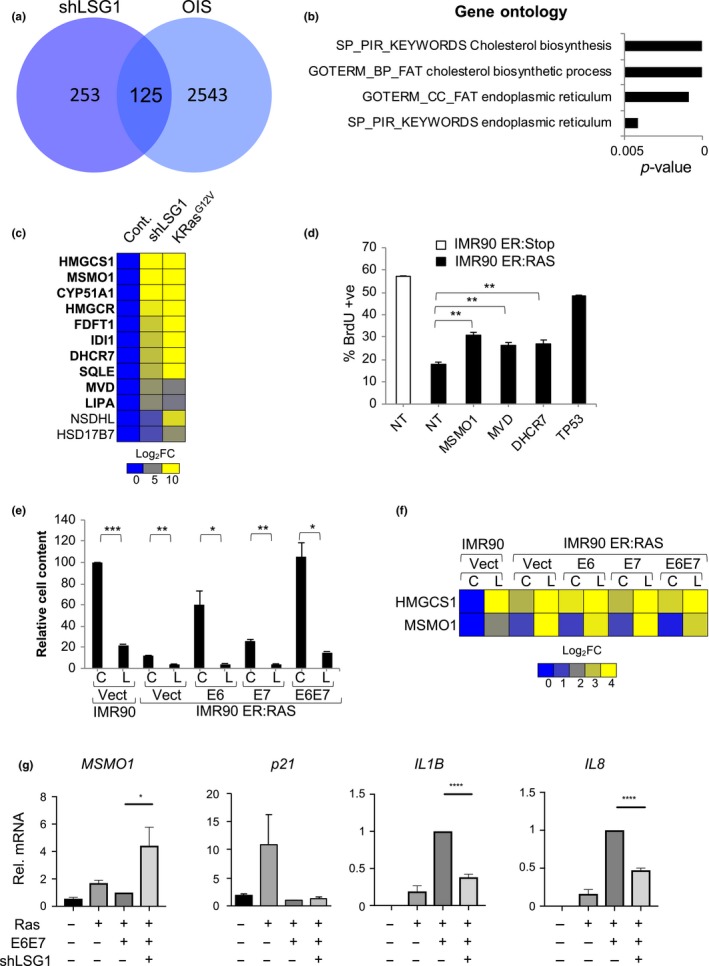
Figure 8.

LSG1 targeting restores the cholesterol/ER senescent programme in H‐RASG12V‐expressing cells that have bypassed senescence. (a) Venn diagram representing the number of genes commonly induced between shLSG1 knockdown induced senescence and OIS in MRC5 cells by AmpliSeq transcriptome analysis. (b) Bar graph representing the p‐value after functional annotation analysis of the most significant GO terms enriched in the 125 genes induced by shLSGI and oncogenic RAS in MRC5 cells as in a. Analysis was performed using the DAVID web resource. (c) Heat map representing mRNA fold change (Log2 scale) in the AmpliSeq expression profile of cholesterol biosynthesis genes in shLSG1‐ and RAS‐transduced MRC5 cells. Each sample represents the mean of 3 experimental replicates. Bold character genes represent significant changes in expression in both conditions. (d) BrdU proliferation assay of IMR90 ER:RAS or ER:Stop control cells 5 days after 4 hydroxytamoxifen (4OHT) treatment and siRNA SMARTpool transfection for the cholesterol biosynthesis genes MSMO1, MVD, DHCR7 and TP53 (as a positive control). Nontargeting (NT) siRNA SMARTpool was used as a negative control. Bars represent the mean of 3 experimental replicates. Error bars represent the SEM. (e) Proliferation assay showing relative cell content of cells transduced with shLSG1 (L) or control (C) lentiviral vectors in cells bypassing OIS. Bypass of OIS was achieved with retrovirus expressing HPV proteins E6, E7, E6E7 or neomycin control. Cells were seeded at low density, cultured for 14 days and stained with crystal violet (CV) as indicated. Bars represent the mean quantification of CV staining of three independent experiments. Error bars represent the SEM. (f) Heat map showing HMGCS1 and MSMO mRNA fold change (Log10 scale) by qRT–PCR from cells treated as in (e) above: C refers to control; L refers to shLSG1. (g) qRT–PCR analysis of IMR90 cells transduced with Vector control, Ras, Ras/E6E7 or Ras/E6E7/shLSG1. MSMO1, p21, IL1B and IL8 were measured. Statistical significance was calculated using two‐tailed t tests or one‐way ANOVA with Dunnett's multiple comparisons tests (Figure 8d). *p < 0.05, **p < 0.01, ***p < 0.001, and ****p < 0.0001
