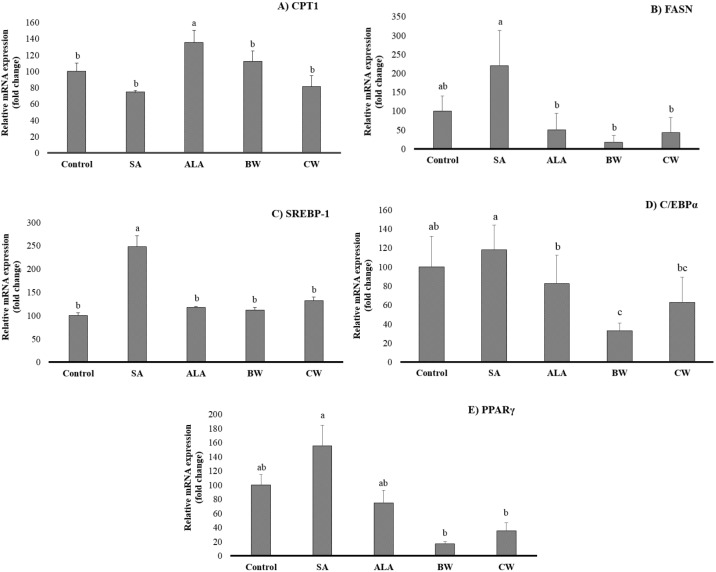
Fig. 6. Effect of stearic acid, alpha-linolenic acid, beeswax, and carnauba wax on adipogenesis-related gene expression in 3T3-L1 cells.
The concentration of fatty acids and natural waxes are 50 μM and 3.00 ppm, respectively. The results are expressed as mean±SD (n=3). The different letter (a–c) in the diagram is a significant difference at p<0.05 by one-way ANOVA, Duncan’s multiple ranges test. SA, stearic acid; ALA, alpha linolenic acid; BW, beeswax; CW, carnauba wax; C/EBPα, CCAAT/enhancer-binding protein family; PPARγ, nuclear receptor peroxisome proliferator-activated receptor γ; FASN, fatty acid synthase; SREBP-1, sterol regulatory element-binding protein 1; CPT-1, carnitine palmitoyl transferase 1.

