
Fig. 1.
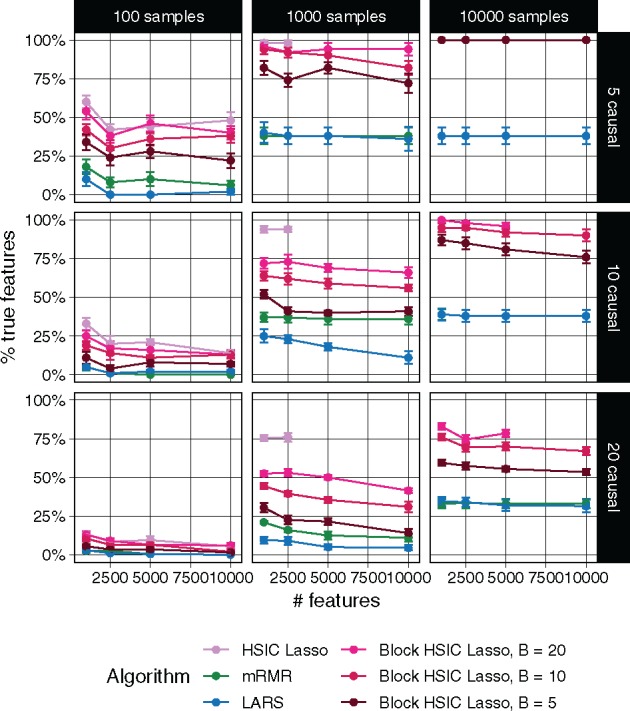
Percentage of true causal features extracted by different feature selectors. Each data point represents the mean over 10 replicates, and the error bars represent the standard error of the mean. Lines are discontinued when the algorithm required more memory than the provided (50 GB). Note that in some conditions mRMR’s line cannot be seen due to the overlap with LARS