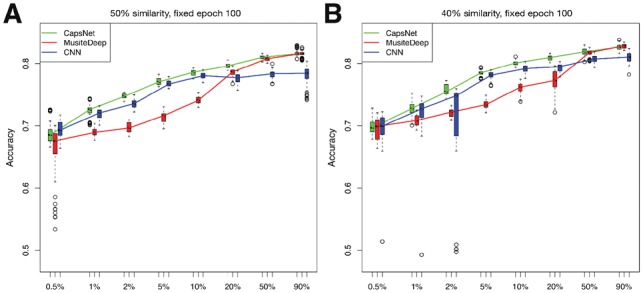
Fig. 3.

Accuracies of CapsNet, MusiteDeep and CNN for phosphorylation (S/T) trained by different sizes of training samples represented in boxplots. The x-axis represents the sampling ratio of the total training samples. The y-axis represents the accuracies of 10-fold cross-validation with each fold trained 10 times. At each ratio, each method generated 100 independent models. For each sampling ratio, we draw three boxplots beside each other for the three methods in the order of CapsNet, MusiteDeep and CNN. The line in the middle of the box represents the median; the box edges represent the 25th and 75th percentiles; the flattened arrows extending out of the box represent the reasonable extremes of the data (the 1.5 times interquartile ranges from the middle 50% of the data) and the open circles beyond the flattened arrows represent outliers for each experiment. (A) and (B) show results of the datasets with fragment-level sequence similarities less than 50% and 40%, respectively
