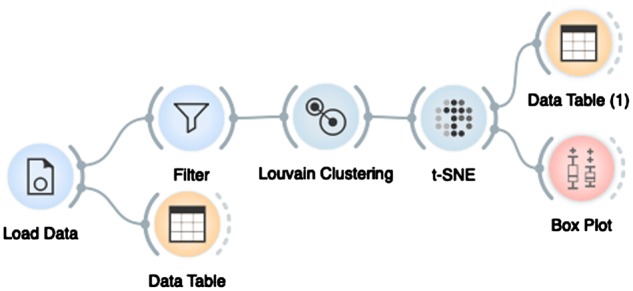
Fig. 1.

An example workflow in scOrange consisting of seven widgets: Load Data widget reads the data from the input files and assembles the data matrix that is then sent to the Data Table for inspection and to the Filter for selection of cells or genes. Louvain Clustering finds clusters of cells and sends cluster-augmented data matrix to t-SNE visualization. In the visualization, the user can select a subset of cells whose data are then inspected in Data Table (1) or summarized with descriptive statistics in the Box Plot
