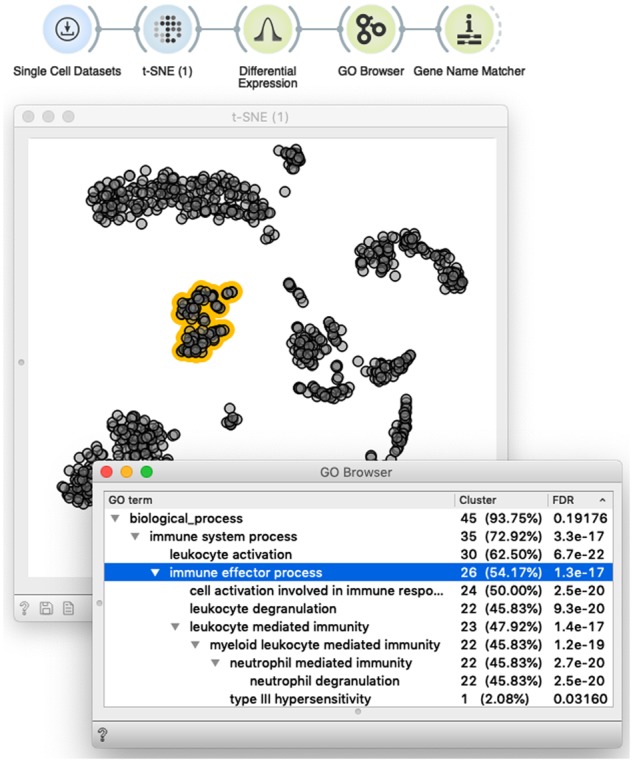
Fig. 4.

Interactivity turns scOrange’s workflows into an explorative data analysis tool. Shown is a simple workflow that loads the data and displays it in the t-SNE plot. The plot supports the interactive selection of cells (dots marked in yellow). The t-SNE widget outputs annotated data matrix with cells labeled based on the selection. The selection-annotated data are passed to the widget that outputs a set of differentially expressed genes, whose common annotation is then displayed in the GO Browser. A list of genes annotated with the selected term (line in blue) is then passed to Gene Name Matcher that displays the list of genes and provides links to their home page (not shown here). The user can interact with this setup by changing the selection of cells, or selecting different GO terms. In both cases, changed selection triggers the update of the downstream components of the workflow, thus enabling on-the-fly explorative data analysis
