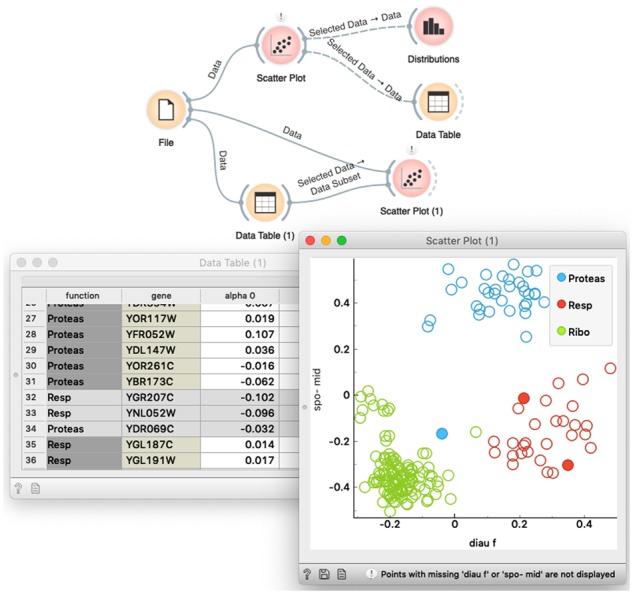
Fig. 5.

A workflow to introduce concepts of visual programming and interactive data analytics. The upper branch of the workflow is used to display the data in a scatter plot and then analyze the selected data subset in two widgets that display summary statistics. The lower branch of the workflow shows hot to highlight the selection of the data from the Data Table in the Scatter Plot visualization
