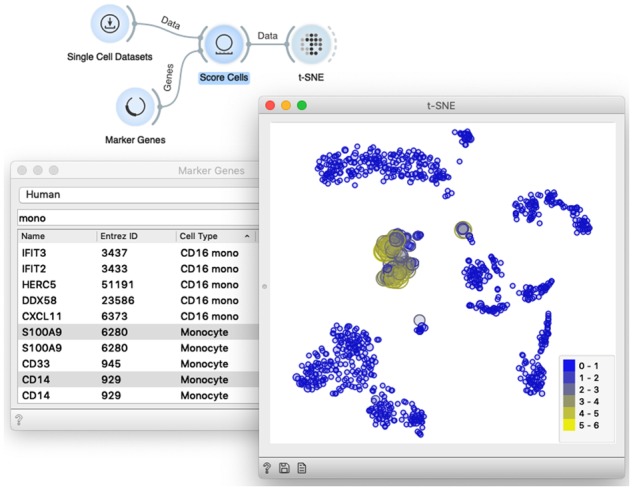
Fig. 6.

Marker genes and cell scoring. The widget Score Cells accepts the data and a list of marker genes and adds a meta attribute with cell’s score to the data matrix. The scores correspond to the average expression of the marker genes. We expose the cells with expressed markers by instructing t-SNE or any point-based visualization to adjust the size or the color of the data point to the score. The workflow shown here is a good example of interactivity in scOrange, as any change in the selection of markers automatically triggers a change in the scatter plot, highlighting the corresponding cells in accordance to the selection
