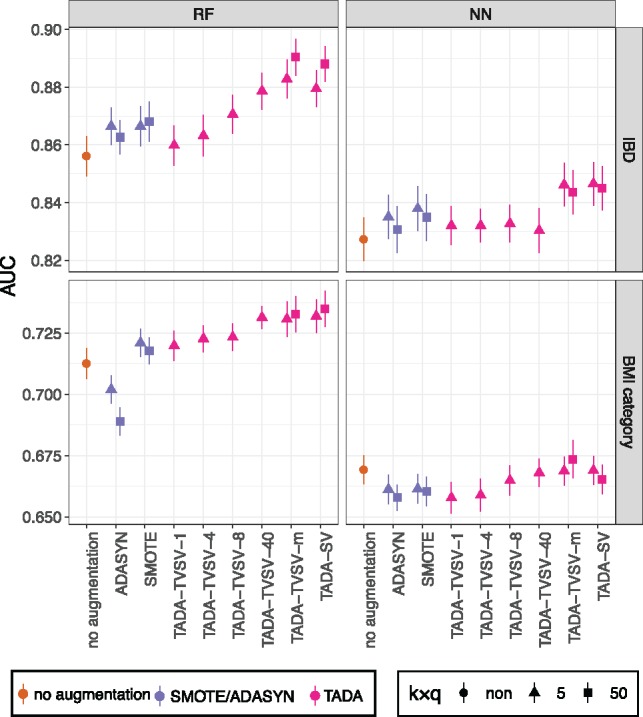
Fig. 2.

Results on E1. Area under curve (AUC) is shown for both neural networks (NN) and random forest (RF) classifiers and on both Gevers IBD dataset and AGP BMI dataset. We compare training on original dataset with no augmentation, SMOTE, ADASYN and using both SV and TVSV versions of TADA. For TVSV-C, we set the number of clusters, C, to 1, 4, 8, 40 or m (number of samples). We used ADASYN and SMOTE with their default settings. We show mean (dots) and standard error over 20 replicates. For TADA-SV, we show both k = 5 and k = 50, and for TADA-TVSV-m, we show both q = 5 and q = 50 with k = 1; see Supplementary Figure S3 for other q and k
