
Fig. 6.
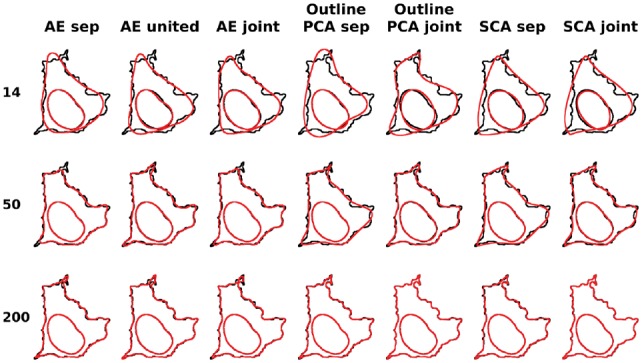
Illustrations of joint modeling of cell and nuclear shapes for different methods for CYTO dataset. Here we choose a cell in the quantile of 0.65 for the joint outline errors for PCA joint models in 200d. The original shape is shown in black and the reconstruction is shown in red. This cell is shown across different methods and different latent dimensions, which are indicated in the title and the Y-axis, respectively