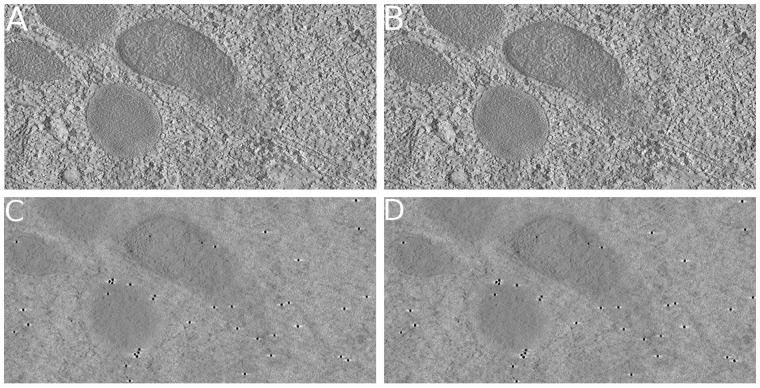
Fig. 7.
The reconstructed tomograms of the filament dataset. The presented tomograms are reconstructed by SART with 40 iterations and 0.2 relaxation factor. (A, C) The middle and top x–y slices of the tomogram reconstructed from the result of IMOD’s fiducial marker-based alignment. (B, D) The middle and top x–y slices of the tomogram reconstructed from the result of our joint method

