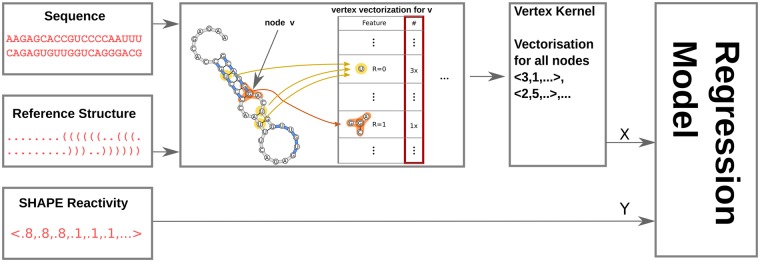
Fig. 1.
Schema of the training process. The input data are triplets of sequence, a reference structure and SHAPE reactivity values for the nucleotides in the sequence. We combine the sequence and the structure to form an RNA-graph. Each vertex in the graph is vectorized such that there is one vector per vertex. The vectors are the input and the associated reactivity values the targets for the regressor to train on

