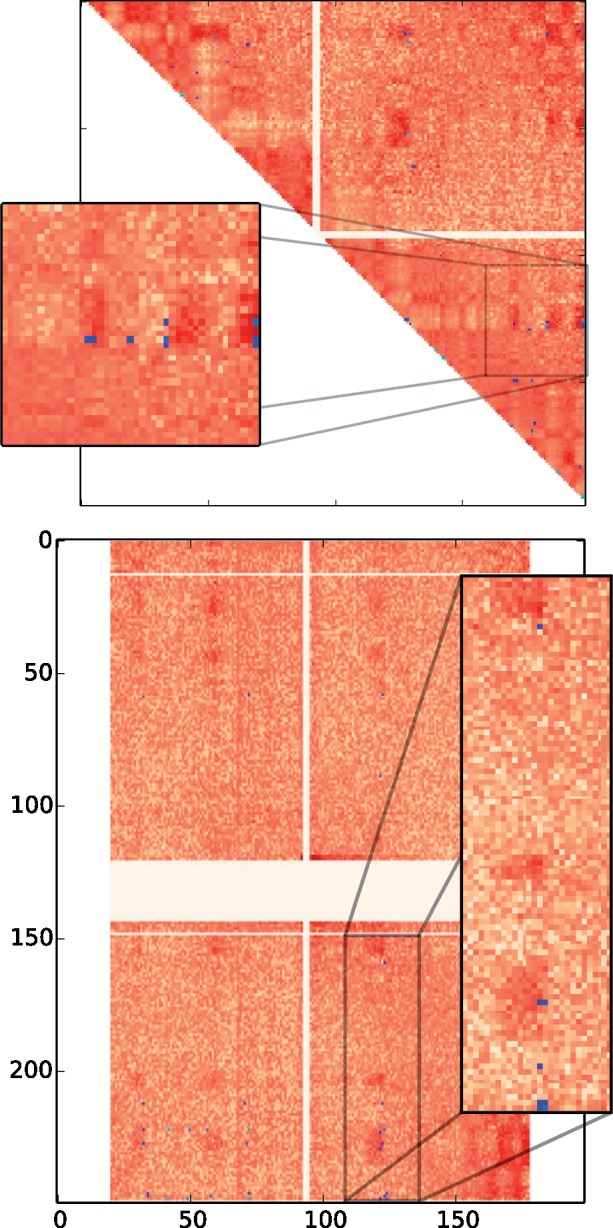
Fig. 1.

Interaction frequency matrices for chromosome 3 (top) and for chromosome 3 against chromosome 1 (bottom). The darker red an entry (i, j) is, the more enriched for 3D contacts the pair of chromosome coordinates (i, j) is. Blue marks correspond to rearrangements from 10 000 DCJ scenarios. The lighter the blue, the higher the number of occurrences of the rearrangement. Square panels are blow-ups of regions from their respective matrices
