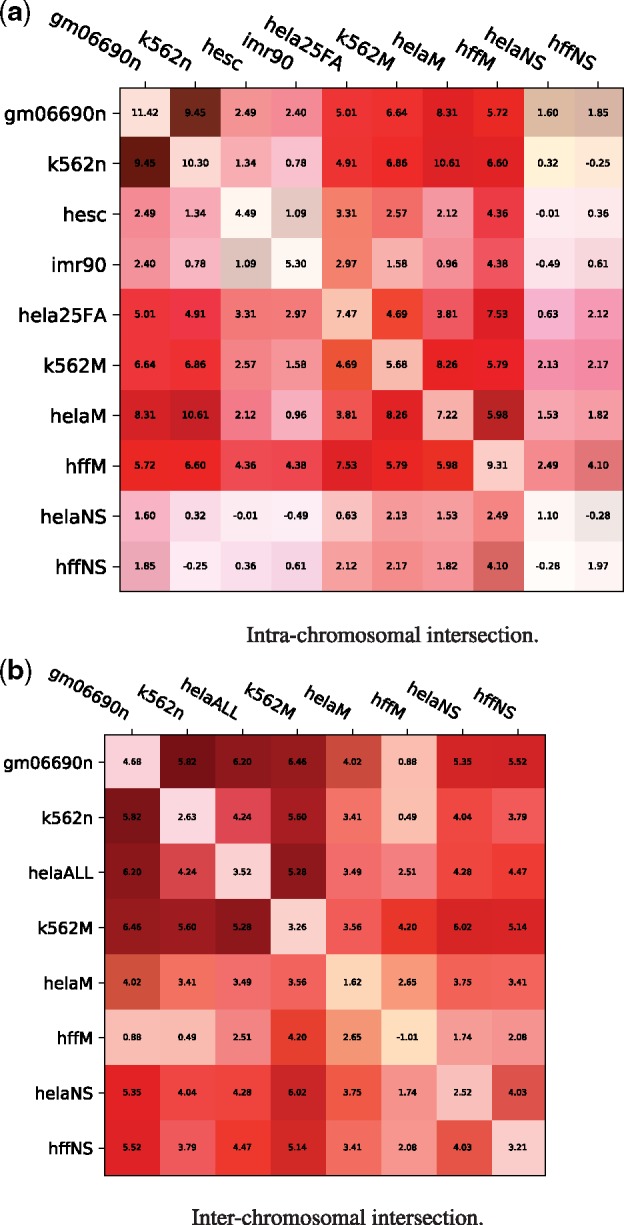
Fig. 6.

Similarities between intrachromosomal Hi-C matrices for different cell lines generally coincide with rearrangement scenarios. Each entry shows the distribution distance, indicating the distance between the randomized and actual distributions computed in the canonical experiment: where is the mean over all actual scenarios and are the mean and SD over all randomized scenarios. The values on the diagonal represent the distribution differences on the original normalized matrices (the distributions in Figures 2 and 3). Each entry has a green bar corresponding to the balance of values chosen for that pair of matrices (if the intersection matrix was composed of values all from one dataset, the entire box edge facing that dataset would be green, a perfectly balanced intersection would have no green bar). (a) Intra-chromosomal intersection. (b) Inter-chromosomal intersection
