
Fig. 3.
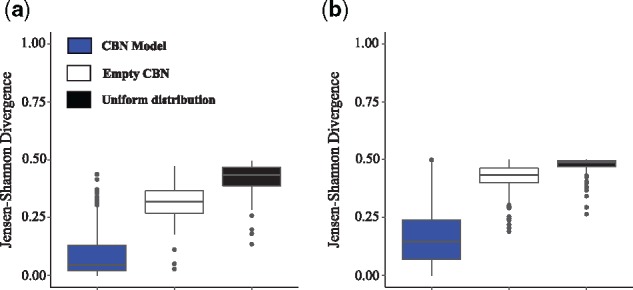
Similarity of the CBN model-based and fitness landscape-based pathway probability distributions. Displayed is the Jensen–Shannon divergence (where a value of 0 denotes the distributions are identical and a value of 1 that distributions do not overlap) between the pathway probability distributions of the fitness landscape approach, P(πw) (Equation (7)), and that of the CBN-based approach, (Equation (10)), (blue boxes), the empty CBN model (white boxes) and the uniform pathway probability distribution (black boxes) in (a) 100 representable and (b) 111 non-representable fitness landscapes in the slow detection and low mutation rate condition. Boxes span the two middle quartiles, and whiskers indicate maxima and minima