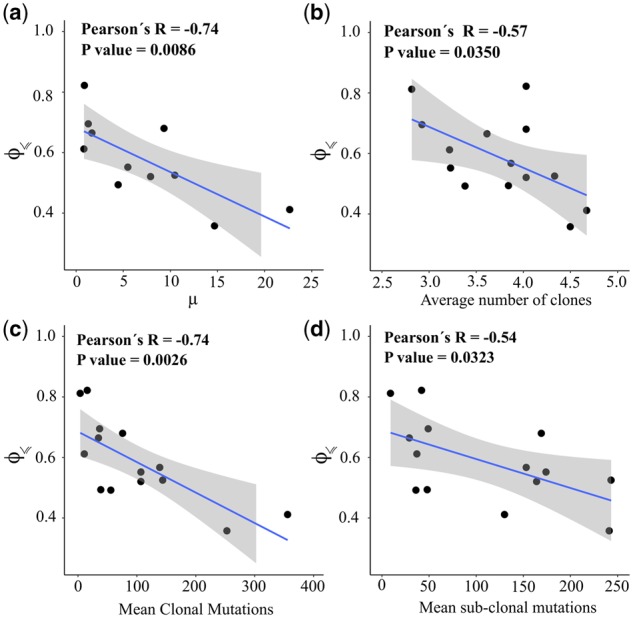
Fig. 5.

Predictability, mutation rate and intra-tumor heterogeneity. In all panels, each point corresponds to a given cancer type and the vertical axis indicates the estimated predictability . The horizontal axis shows (a) the average mutation frequency per mega base-pairs [from Lawrence et al. (2013)], (b) the average number of clones per tumor, (c) the mean number of clonal mutations and (d) the mean number of sub-clonal mutations according to Raynaud et al. (2018). The blue lines are the linear regression models surrounded by a shaded confidence interval region. Evolutionary predictability is approximated using Equation (12), with n=10 and for the TCGA data. Note that in panel (a) only 11 cancer types are included in this analysis, because Lawrence et al. (2013) covered only 11 of the 15 cancer types
