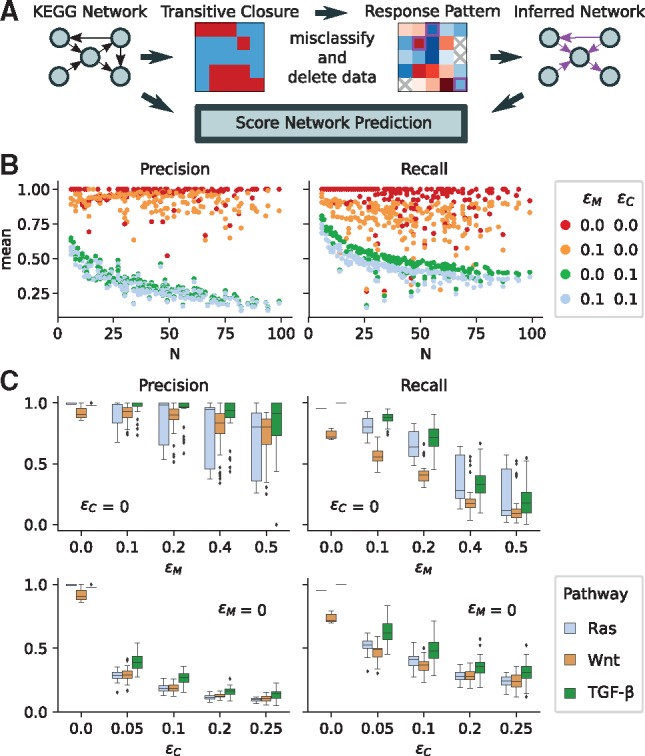
Fig. 3.

The performance of the response logic approach on synthetic data generated from 270 human KEGG pathways (Kanehisa et al., 2017). N denotes network size, ϵM quantifies the fraction of missing and ϵC the fraction of misclassified data points. (A) Data generation and scoring scheme. (B) Each dot per colour represents a different pathway, colours represent different parameters for misclassification (ϵC) and missing data (ϵM). (C) Precision and recall for three particular signalling pathways as a function of the fraction of misclassified or missing data
