
Fig. 4.
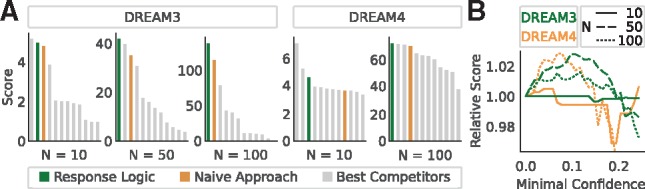
(A) Performance of the response logic approach for the gene-network reverse engineering challenges DREAM3 and DREAM4 (Greenfield et al., 2010; Marbach et al., 2010) (green bars), compared with a ‘naïve’ scoring approach (orange bars) and the 10 best approaches that took part in the respective challenges (grey bars). Scores are calculated as in the original challenge, with higher scores indicating better performance. (B) Relative changes in performance when excluding data points with confidence below a certain threshold. N: network size