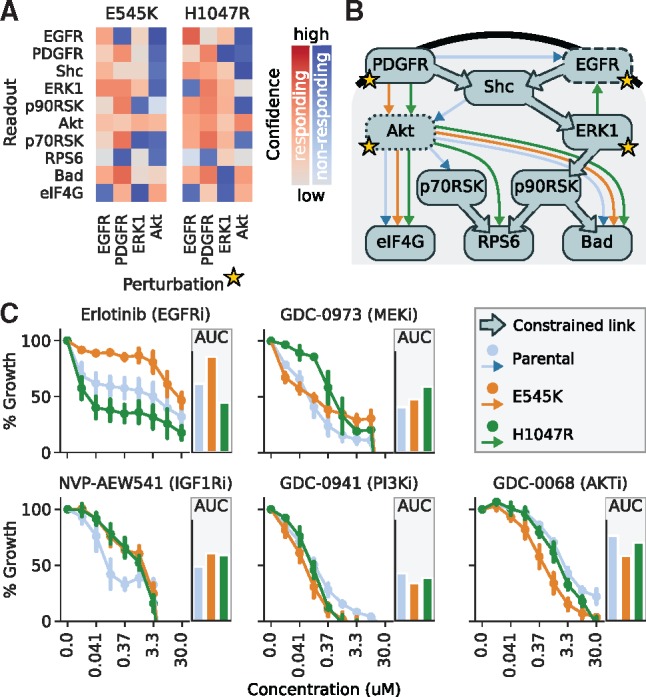
Fig. 6.

(A) Response pattern for two PI3K-mutant cell lines derived from SW-48, carrying either the E545K or H1047R mutations in PIK3CA, as in Figure 5. (B) Mutant-specific networks derived from the response data arrows in blue (parental cell line), orange and green (two mutant cell lines), with links constrained due to literature knowledge shown with large arrows. (C) Dose–response curves for different inhibitors targeting the inferred networks in the parental cell line (blue) and the two clones with PI3K mutations (orange and green), and the area under the curve displayed as bar graphs
