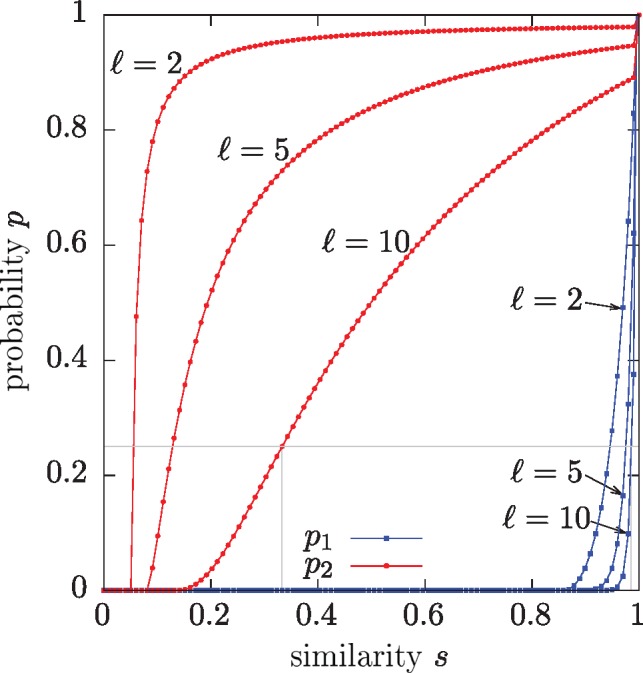
Fig. 3.

The relationships between the similarity thresholds s1 and s2, and the probabilities p1 and p2, for n = 100, k = 5. Given a probability, e.g. shown by the horizontal gray line, the OMH method can distinguish between similarities below s2 (below left vertical gray line) and from similarities above s1 (above the right vertical gray line). The functions are defined at discrete points, when ns is integral, represented by the circles and squares
