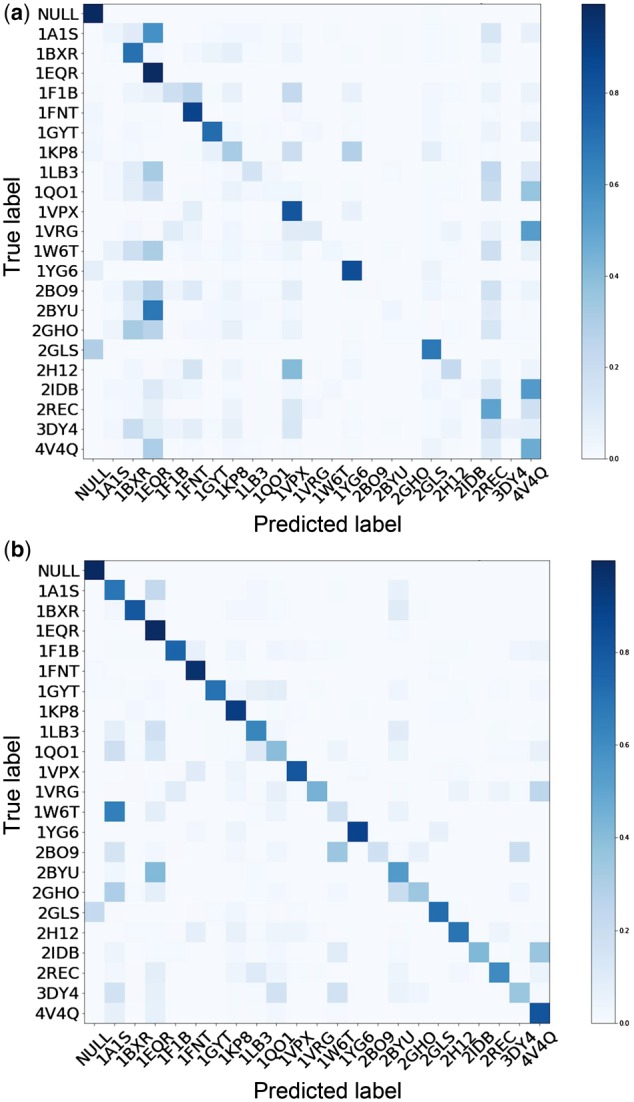
Fig. 5.

Confusion matrices of target domain class predictions: (a) before 3D-ADA and (b) after 3D-ADA. Each row represents the predicted class of an instance while each column represents the true class. The darker the cells are, the larger proportion of samples are predicted to be the specific class. A perfect classification will show a black diagonal with all cells on it having a value of 1.0
