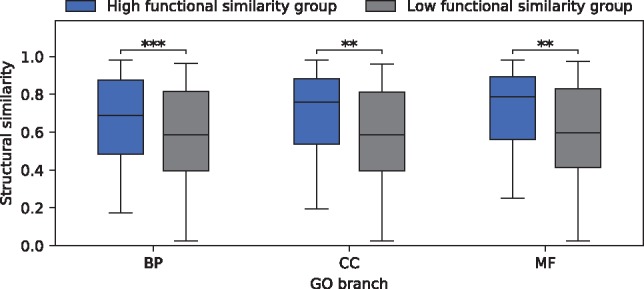
Fig. 5.

Average structural similarity between isoforms of MIGs with low or high functional similarities. Significant differences are observed in all the GO branches according to the Kruskal–Wallis tests (with P-values ***P = 5.77e-04, **P = 2.50e-03 and **P = 3.30e-03 for BP, CC and MF, respectively). Note that the semantic dissimilarity score can only be calculated for MIGs containing two or more isoforms with GO terms in the same branch. This results in 296 (167 or 155) out of the 300 MIGs considered for the BP (CC or MF) branch
