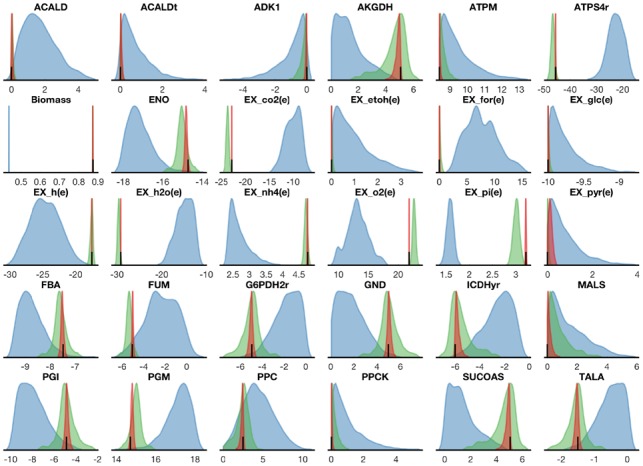
Fig. 2.

Posterior flux distributions of E.coli core model. The blue color indicates fluxes in 50% growth, the green color maximal growth, the red color maximal growth with nine exchange fluxes specified, and the conventional FBA solution is a black line. Reaction abbreviations and names are listed in Supplementary Table S1
