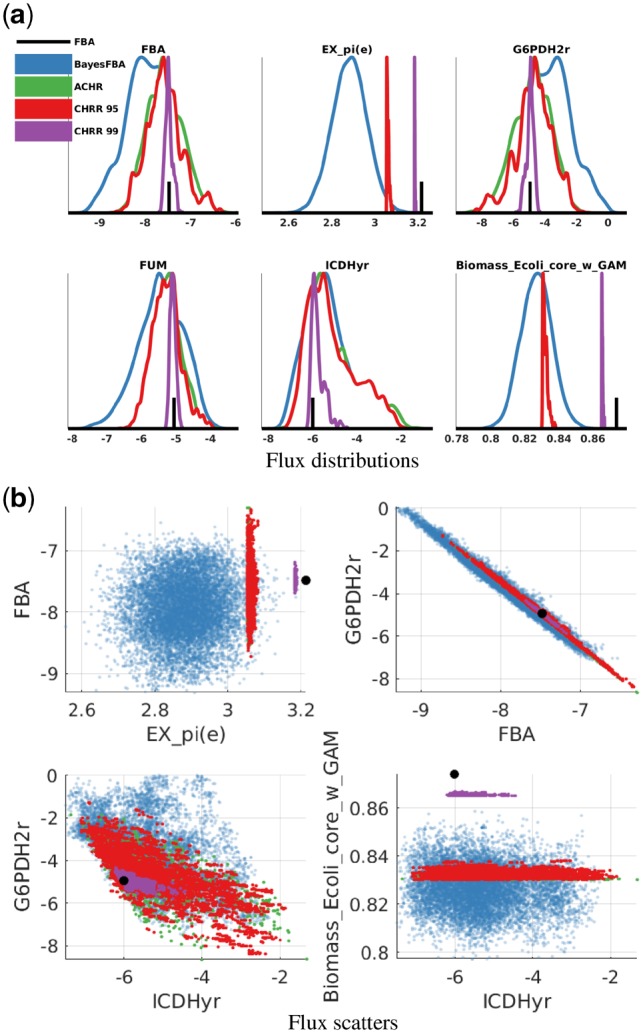
Fig. 5.

Sampler comparison on the E.coli core model around the FBA solution (black). The ACHR (green), CCHR 95% (red), CCHR 99% (purple) and BayesFBA (blue) distributions are shown for six example flux distributions (a), and for four example pairwise flux distributions (b). The green and red overlap heavily
