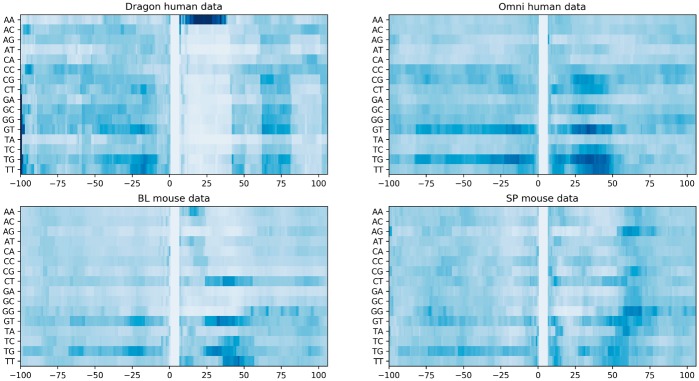
Fig. 2.
Visualization of the importance of different dimers at different positions for models trained with four datasets. The colors denote the contribution of the dimer at that position to determining a true PAS motif. The darker blue, the more contribution the dimer at that position has to determining a true PAS motif. The more white, the less contribution. The x-axis shows the positions of the dimer in the sequence, where Position 0 is the first base of the PAS motif. The y-axis lists all possible dimers

