Fig. 3.
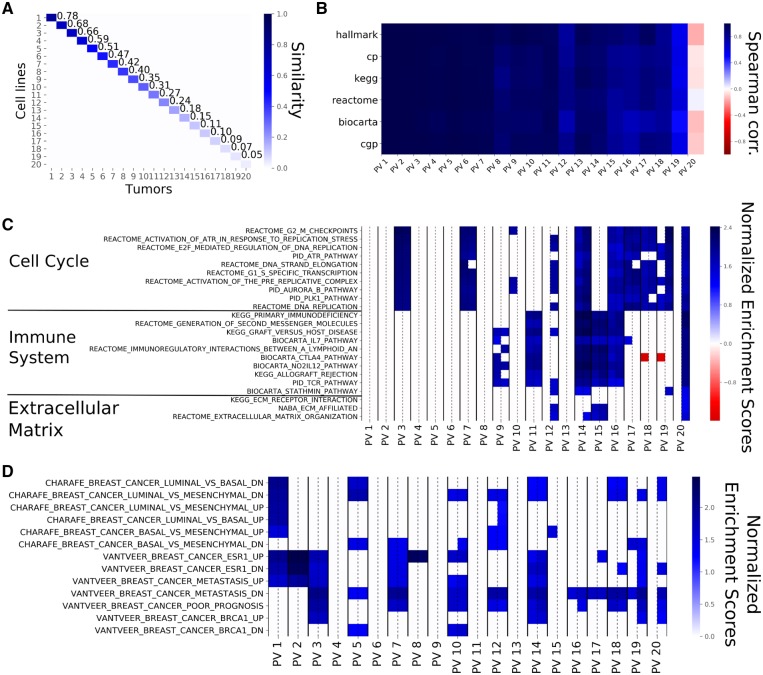
PVs computed from breast cell lines and breast tumors from 20 principal components. (A) The Cosine Similarity matrix for cell line and tumor PVs. The values on the diagonal show the similarities within the corresponding pairs of PVs. Similarity starts at 78% and goes down to 2% for the last pair (not shown). The off-diagonal values are almost zero, showing that pairs of PVs of unequal rank are orthogonal to one another. (B) The Spearman correlations between the Normalized Enrichment Scores (NES) of source and target PVs for the different gene sets employed. The top PVs show similar enrichments while the bottom ones show little similarity, even negative correlation. This shows that top PVs represent the same biological phenomena. (C) The NES based on the canonical pathways for each PV pair with the NES for the source PV on the left and the NES for the target PV on the right (separated by a dashed line). Non-significant gene sets are represented as white cells. For this figure panel, we selected the 10 gene sets that were most highly enriched in the first five PVs, the 10 gene sets that showed the highest enrichment in the bottom PVs as well as all the gene sets related to extra-cellular matrix. The top PVs are exclusively enriched in pathways related to cell cycle. Immune system-related pathways are enriched in the middle and bottom PVs and PVs at the bottom tend to show enrichment for the target PVs only. (D) The NES for each PV as displayed in (C), for the CHARAFE and VANTVEER gene sets. The top PVs are significantly enriched in sets associated with breast cancer subtypes

