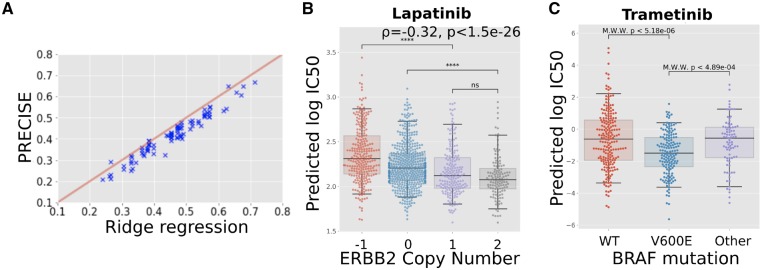
Fig. 4.
Predictive performance assessment. (A) Scatterplot of the performance of PRECISE and Ridge regression. Predictive performance for each approach was computed as the Pearson correlation between the measured and the 10-fold cross-validated predicted s. PRECISE and Ridge regression performance is strongly correlated, with PRECISE showing a slight drop in performance. (B) Predicted drug response (predicted ) for breast tumors based on a predictor of Lapatinib response trained on all the cell lines—i.e. across all tissue types—employing gene expression data only. ERBB2 copy number status in tumors correlates significantly with predicted values, validating the predictions, as tumors with ERBB2 amplifications are known to be more sensitive to Lapatinib. (C) Predicted drug response (predicted ) for skin melanoma tumors based on a predictor of Tramatinib response trained on all the cell lines—i.e. across all tissue types—employing gene expression data only. The PRECISE predictions are validated by the established fact that -mutated tumors show a significantly higher sensitivity while the tumors bearing other mutations in do not show responses that differ from wild-type tumors

