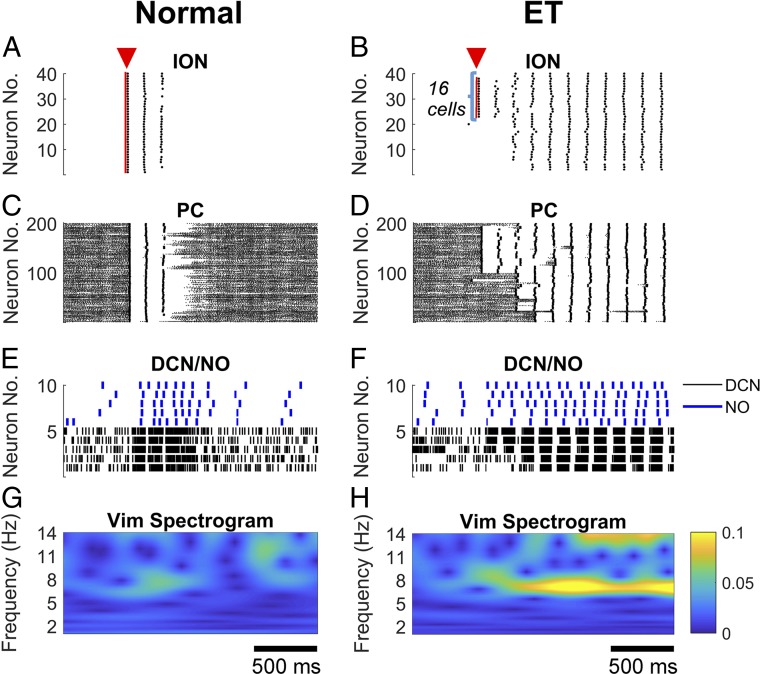
Fig. 6.
Scale-up model (i.e., 425- instead of 85-single compartment model) under normal, tremor-free condition (A, C, E, and G) and ET condition (i.e., yellow circle in Fig. 3A) (B, D, F, and H), respectively. (A) A current pulse (duration, 20 ms; amplitude, 10 pA) was applied to all 40 ION neurons simultaneously (red triangle), which led to synchronous firing of ION neurons for 2–3 cycles but no tonic spiking activity. (B) The same current pulse as in A was applied to 16 ION neurons simultaneously under ET condition (red triangle) and caused tonic spiking activities that spread to the entire ION neuron population. (C–F) Spiking pattern of the PC, DCN, and NO neurons in response to the exogenous pulse to the ION neurons in A (C and E) and in B (D and F). (G and H) Power spectrogram of the Vim in response to the pulse to the ION neurons in A (G) and in B (H). Note that under ET condition, a prominent 7–8 Hz oscillation emerged in the spectrogram after the ION neurons were engaged into tonic spiking. Time scales in G and H also apply to A, C, and E and B, D, and F, respectively.

