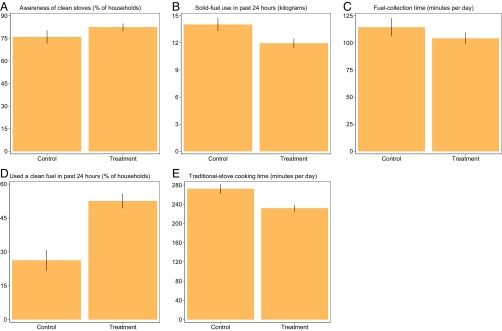
Fig. 2.
Mean household-level awareness of clean stoves (A), solid-fuel use (B), fuel collection time (C), clean-fuel use (D), and time spent cooking on traditional stoves (E) by treatment group. Means derived from first-round follow-up surveys conducted ∼3 mo after intervention. Error bars indicate 90% confidence intervals. See SI Appendix, Table S1 for additional details.

