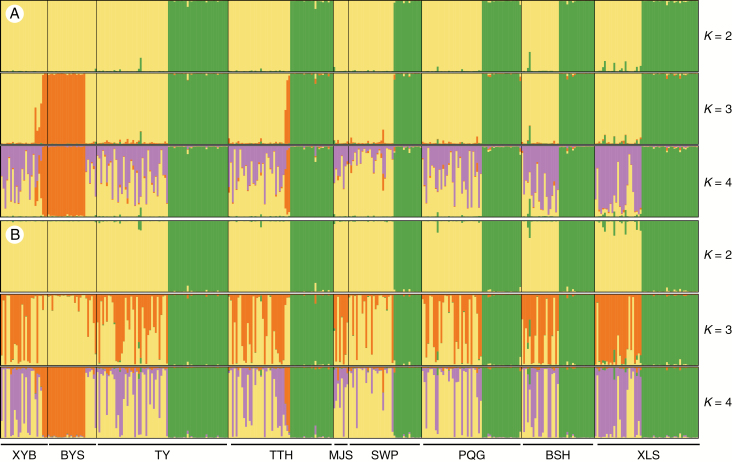
Fig. 4.
STRUCTURE output for microsatellite datasets D1 (A) and D2 (B) at K = 2, 3 and 4. The optimal cluster number for D1 and D2 is 3 and 4, respectively, based on the ΔK value. Sampling locations are separated by thin black lines and labelled at the bottom of the figure. At K = 2, individuals predominantly coloured green are white birch and individuals predominately coloured yellow are red birch. At K = 4, individuals predominately coloured orange are ‘diploid’ red birch.

