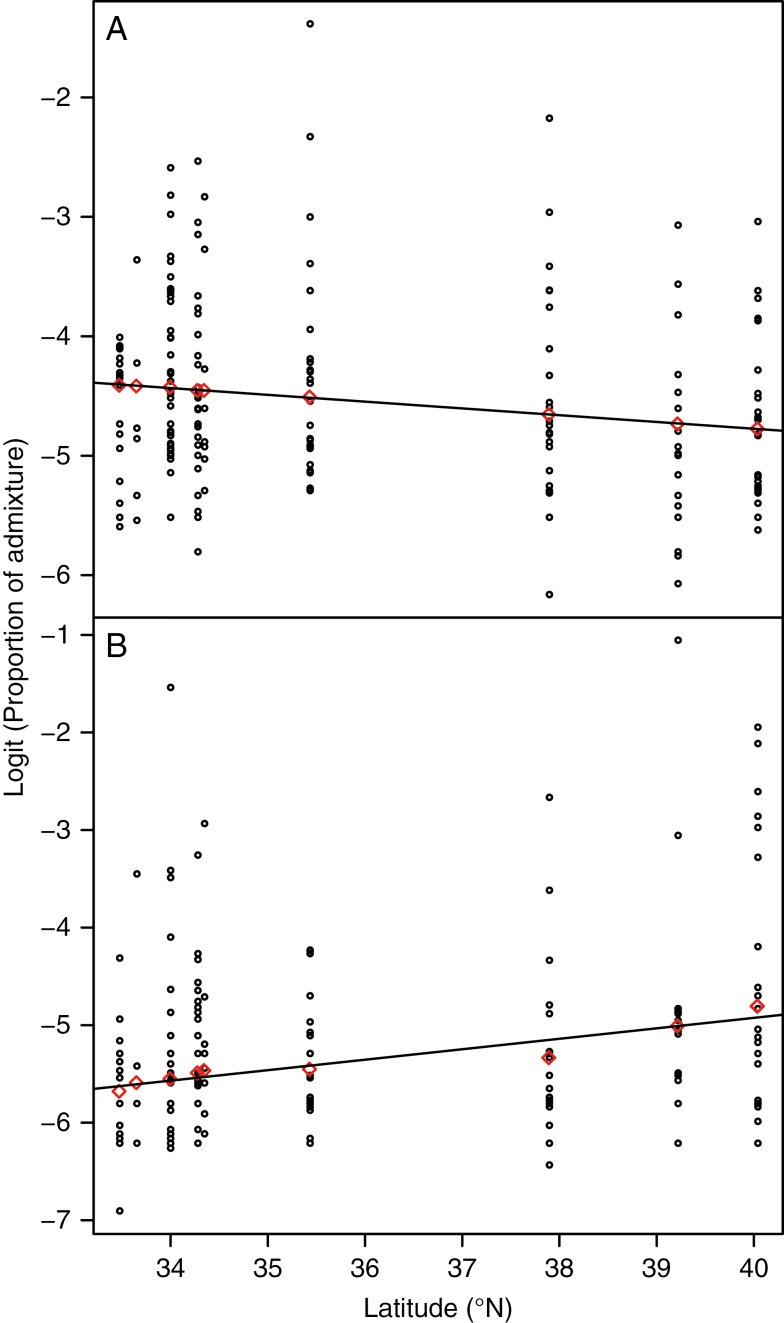
Fig. 5.
Clines of ‘diploid’ red birch and white birch admixture in ‘allotetraploid’ red birch populations. The horizontal axis and circles show the latitude of each sample populations and logit-transformed STRUCTURE admixture proportions for each ‘allotetraploid’ red birch individual, respectively. Red diamonds indicate the value for each ‘allotetraploid’ red birch population fitted by the mixed effects model. (A) The cline of ‘diploid’ red birch admixture into ‘allotetraploid’ red birch populations, which showed a non-significant but negative correlation with latitude (P = 0.0551). (B) The cline of white admixture into ‘allotetraploid’ red birch populations, which showed a non-significant but negative correlation with latitude (P = 0.0755).

