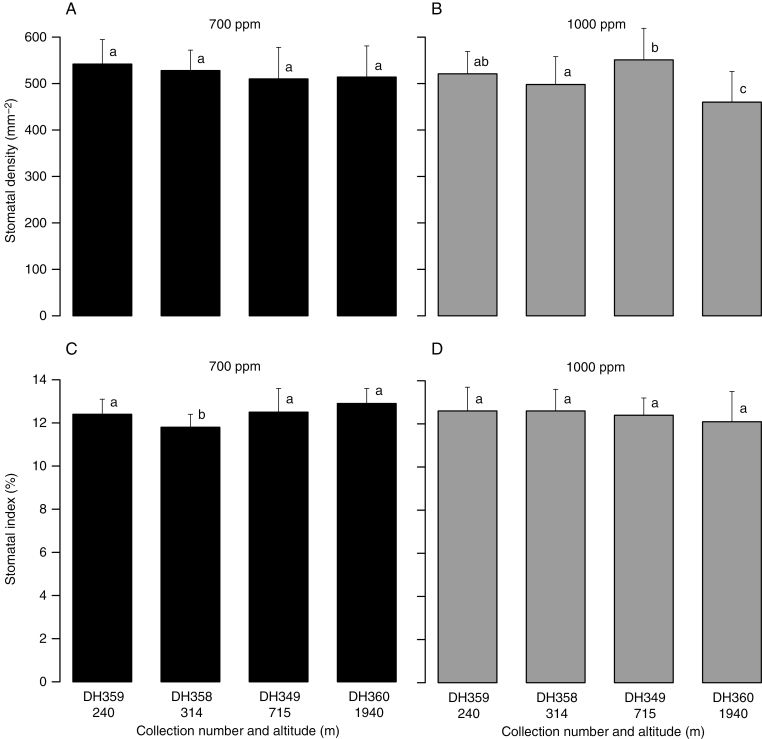
Fig. 4.
Changes in stomatal frequency (A and B, stomatal density; C and D, stomatal index) for Quercus glauca collected from different altitudes and treated under the same CO2 concentration for 1 year. Histograms were labelled as the collection numbers and altitudes. Error bars represent + 1 s.d. Different letters above the histograms indicate a significant difference.

