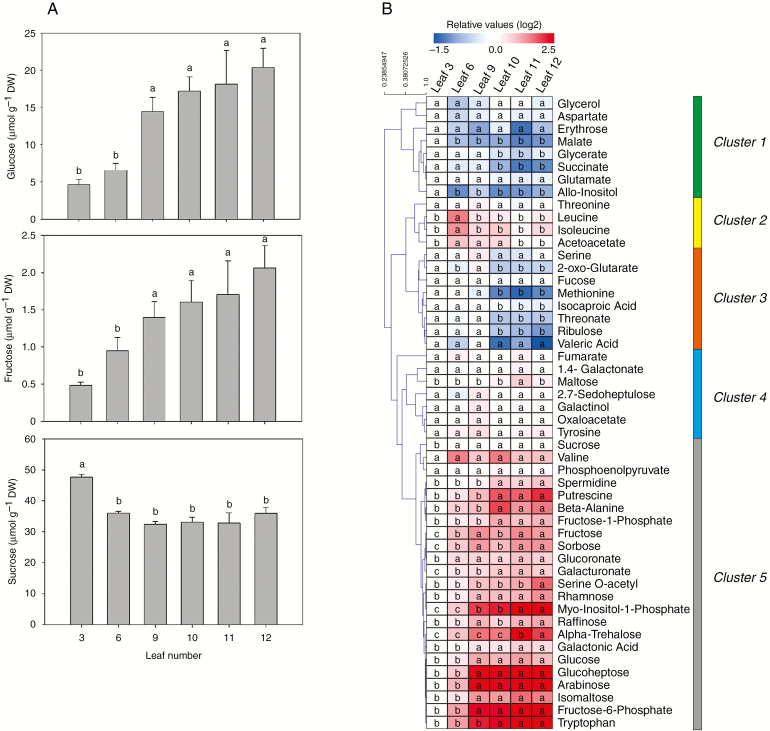
Fig. 3.
Several metabolites, including soluble carbohydrates, dynamically change during the heteroblastic process in P. edulis leaves. (A) Glucose, fructose and sucrose were quantified during leaf development from juvenile to adult at 30 dpe. Values are mean ± s.e. of five independent biological replicates. Different lower-case letters indicate significant differences (P < 0.05). (B) Metabolite profiling of P. edulis leaf development was performed as described by Lisec et al. (2006). Data are presented as a heat map loaded with the mean of five independent biological replicates. Data were normalized with respect to the average response calculated for the third leaf. DW, dry weight. The colour code is given at log2 scale, in which blue and red represent down- and up-abundance, respectively. Different lower-case letters indicate significant differences (P < 0.05). The metabolites were grouped into five clusters, as described in the text.

