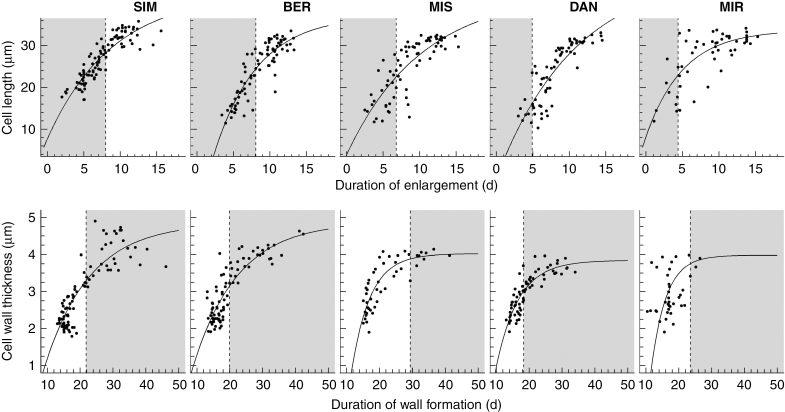
Fig. 4.
Cell traits vs. the duration of their developmental phases plotted using the modified von Bertalanffy equation. The top row presents cell diameter vs. the duration of enlargement. Cell wall thickness vs. the duration of lignification is presented in the bottom row. The dashed line represents the threshold between earlywood and latewood; the light grey background represents the latewood portion. Each plot represents one of the five sites along a latitudinal gradient across the closed boreal forest of Quebec, Canada.

