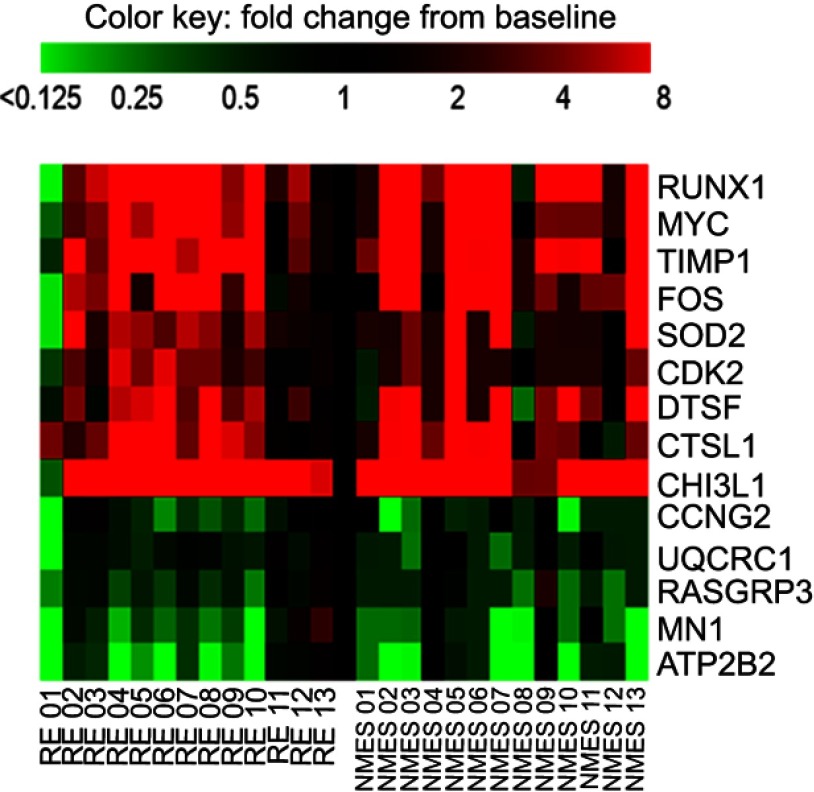
Figure 2.
Heatmap demonstrating individual variation in response to transcutaneous neuromuscular electrical stimulation (NMES) and resistance exercise (RE) for the 14 transcripts that were significantly influenced by both interventions. Scale capped at 8-fold change, baseline value =1. Abbreviated gene names used in this figure are defined in Table S1.

