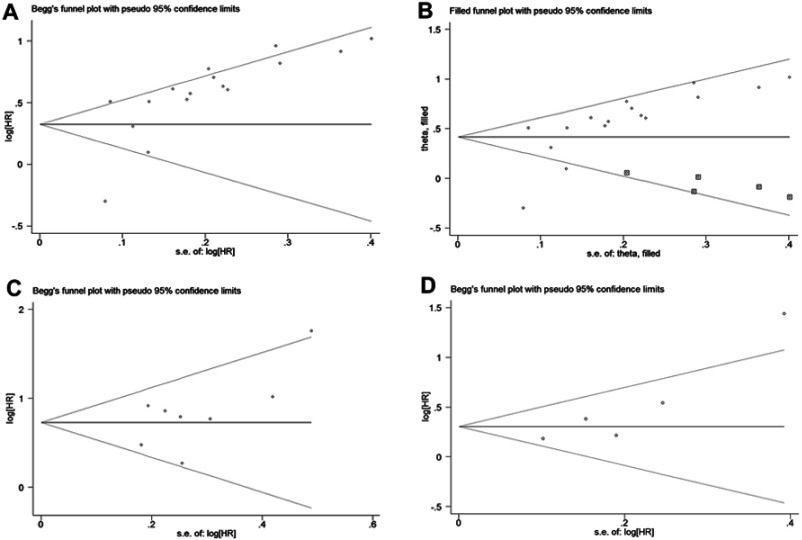
Figure 5.
Funnel plots assessing the potential publication bias of the included studies. (A) Funnel plot of publication bias for overall survival. (B) Funnel plot adjusted by trim-and-fill analysis for overall survival. (C) Funnel plot of publication bias for cancer-specific survival. (D) Funnel plot adjusted by trim and fill analysis for recurrence-free survival.

