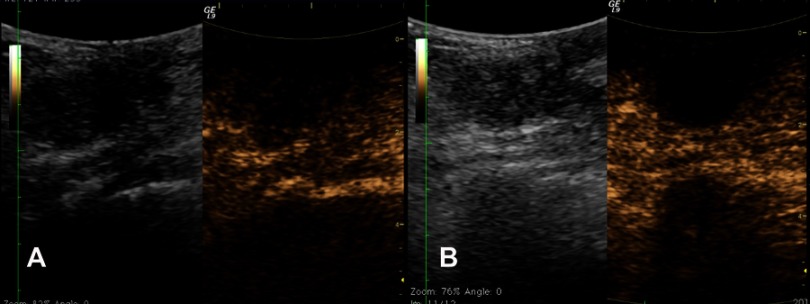
Figure 3.
The contrast enhanced ultrasonography images before (A) and 48 minutes after treatment (B). (A) The left image shows a 3.0 cm irregular, hypoechoic mass with obscure boundary at right breast, located beside the nipple. The right image shows the blood flow signal inside the mass 52 seconds after contrast injection. (B) The left image shows the echo of mass enhanced; the right image shows non-contrast enhancement in the mass because of the vessel occlusion caused by high intensity focused ultrasound ablation.

