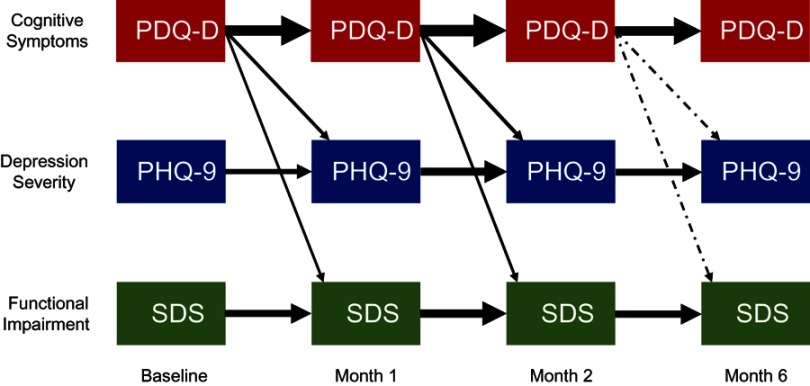
Figure 4.
Temporal interdependencies among patient-reported measures of cognitive symptoms, patient-reported depressive symptoms, and functional impairment. Standardized regression coefficients based on the structural equation models (SEM) with p-values <0.05 (n=451). The thickness of arrows is proportional to the strength of association. A solid arrow indicates p-value <0.001; a dot-dashed arrow indicates p-value <0.05.
Abbreviations: PDQ-D, Perceived Deficits Questionnaire – Depression; PHQ-9, Patient Health Questionnaire-9; SDS, Sheehan Disability Scale.

