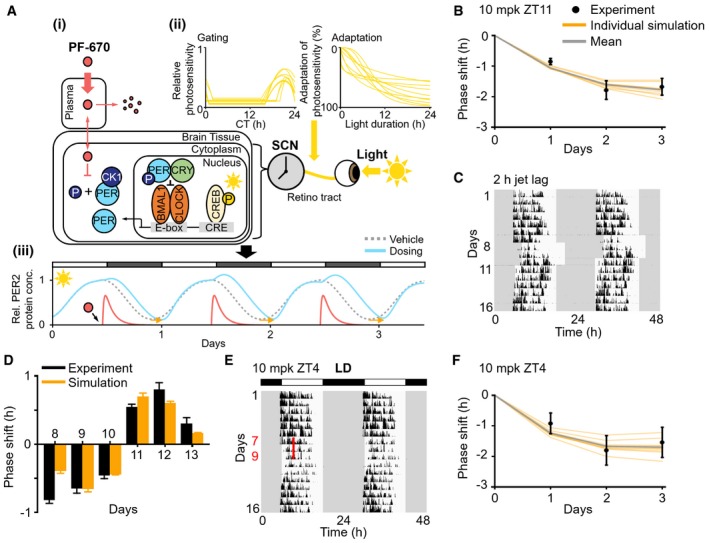
Figure 2. Systems chronopharmacology model accurately simulates the phase shift of NHPs induced by PF‐670 and light.

- Description of the systems chronopharmacology model for NHP. (i) The translocation of PF‐670 from plasma to the SCN and its inhibition of PER phosphorylation by CK1δ/ε in NHP (Fig EV1A) were accurately modeled to reproduce the PF‐670 exposure (Figs 1B and EV1B) and its effect in NHPs (Figs 1E and EV1C). (ii) The dependence of light‐induced Per1/2 gene transcription via CREB on circadian time (gating) and light duration (adaptation) is included in the model (Fig EV1F–H). The estimated 10 pairs of gating and adaptation allow for the model to successfully reproduce the light‐induced phase shift in NHPs and humans (Fig EV2). (iii) The model simulates the combined effect of PF‐670 (i) and light (ii) on PER2 rhythms in the SCN of NHPs.
- The model accurately reproduces the phase delay of NHPs induced by 3‐day LD dosing at ZT11. Here, the PF‐670‐induced phase delay from which the vehicle‐induced phase shift is subtracted was used (n = 8; mean ± SEM; Fig 1F). Each orange line is an individual simulation result obtained with each pair of gating and adaptation in (Aii), and their average is represented by the gray line.
- Double‐plotted actogram of NHPs’ activity for 16 days. The light is on at 6 am and off at 6 pm except for days 8 to 10 when the light is on at 8 am and off at 8 pm (i.e., LD is delayed by 2 h).
- The model successfully predicts the phase shift induced by 2‐h jet lag (days 8–10) and its recovery after jet lag (days 11–13) (n = 7; mean ± SEM; C).
- NHPs were treated with 10 mpk PF‐670 for 3 consecutive days at ZT4 in LD 12:12, which are highlighted as the red line.
- The phase delay induced by 3‐day LD dosing at ZT4 (n = 8; mean ± SEM; E) is accurately predicted by the model.
