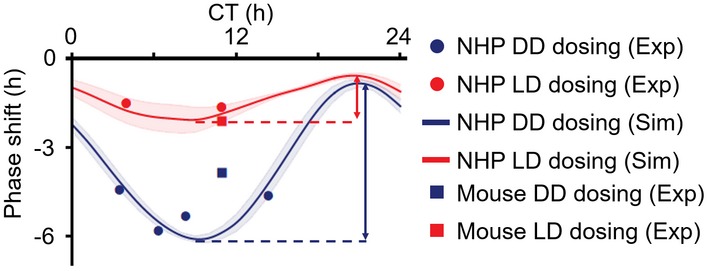
Figure EV3. The phase delays induced by 3‐day PF‐670 dosing in NHPs and mice under DD and LD.

NHPs and mice were treated with PF‐670 for 3 days (Figs 1E and F, and 2F, and EV1C). Due to the higher drug exposure in NHPs than in mice (Fig 1B), all NHPs, which were treated with 10 mpk PF‐670 at various dosing times (CT4, 6, 8, 14) in DD, show a larger phase delay (filled blue circles) than mice dosed with 32 mpk PF‐670 at CT11 in DD (empty blue circle). Thus, the phase delay of NHPs induced by 10 mpk PF‐670 dosing at CT11 is expected to be larger than that of mice dosed with 32 mpk PF‐670 at CT11 under DD, which is supported by the model simulation (blue line). Due to the strong attenuation of the PF‐670 effect by light in NHPs, the change in drug effect upon dosing time is much smaller in LD (from 0.6 h to 2.1 h; red arrow) than in DD (from 0.8 h to 6.1 h; blue arrow). Dosing time is denoted by the x‐axis. The line and colored range represent the mean ± SD of the simulated phase delays of NHP models with the 10 pairs of gating and adaptation (Figs 2Aii and EV2F).
