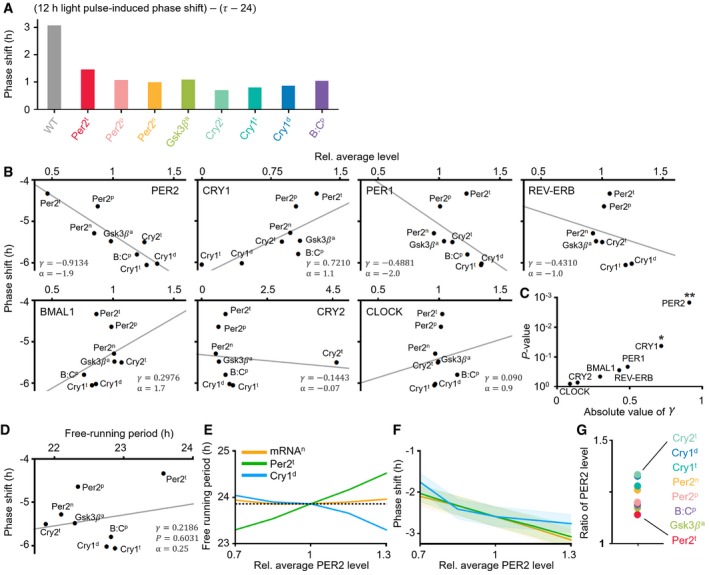
Figure EV5. The response of the ASPD models to light and PF‐670: PER2 level is strongly correlated with the effect of CK1i.

-
AAll ASPD models simulate the weaker light‐induced attenuation of the effect of PF‐670 than the WT model when PF‐670 induces the 4‐h phase delay under LD 12:12. As the free‐running period (τ) of the ASPD models is shorter than 24 h (Fig 4A), the light needs to induce the phase shift (24‐τ) to equalize the period of ASPD models to 24 h. Thus, by subtracting 24‐τ from a light‐induced phase shift to remove the entraining effect of light, the light‐induced attenuation of the effect of PF‐670 is estimated. The light‐induced phase shift is simulated using a 12‐h light pulse given at CT20 since it corresponds to the light pulse in LD 12:12 when PF‐670 induces a 4‐h phase delay. See Datasets EV2 and EV3 and Materials and Methods for details of the WT model and ASPD models.
-
BThe correlation between the effect of PF‐670 (red squares; Fig 4B) and the average level of various core clock proteins of the ASPD models (Dataset EV3). The line represents the least‐square fitting line. r and α denote the Pearson's correlation coefficient and the slope of the least‐square fitting line.
-
CThe average protein level of PER2 is significantly more strongly correlated with the effect of PF‐670 than that of other clock proteins. * and ** indicates P < 0.05 and P < 0.001, respectively. Here, P‐value is estimated by Pearson's correlation test.
- D
-
E, FAs PER2 level increases in the model, regardless of the change in the free‐running period (E), the effect of CK1i becomes stronger (F). The mRNAn (orange line), Per2t (green line), and Cry1d (blue line) were simulated by perturbing the parameters tmc, trPt, and uro, which describe the nuclear export rate of mRNA, the transcription rate for Per2, and the degradation rate for CRY1, respectively (see Dataset EV1 for details). The line and colored range in F represent the mean ± SEM of the phase delays induced by a single 20 mpk DD dosing at CT1, 2, 3, …, 24.
-
GThe ratio of average PER2 levels in LD 8:16 and LD 16:8 when dosing occurs (red squares; Fig 4B) is higher than 1 in all ASPD models: PER2 level is higher in LD 8:16 than in LD16:8 when dosing occurs.
