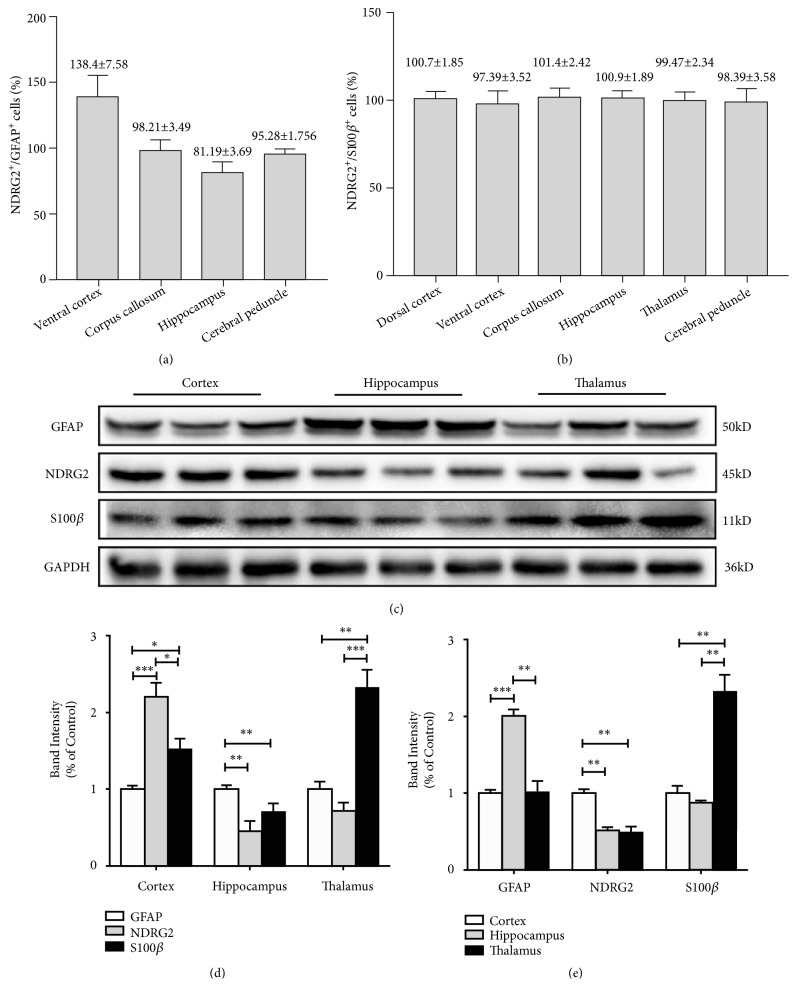
Figure 8.
The colocalization and protein expression of NDRG2, GFAP, and S100β in different cerebral regions. (a)-(b) The quantitative analysis of NDRG2+/GFAP+ astrocytes and NDRG2+/S100β+ astrocytes. Results were presented as the mean ± SD. Cells in five fields were counted. (c)-(e) The expression levels of NDRG2, GFAP, and S100β proteins in cortex, hippocampus and thalamus of the adult male mice (6 months) were determined by Western blot analysis. Representative blots and quantitative analysis were shown. Results were presented as the mean ± SD and analyzed by one-way ANOVA with Tukey's posttests. n = 6. ∗p<0.05, ∗∗p<0.01, and ∗∗∗p<0.001.

