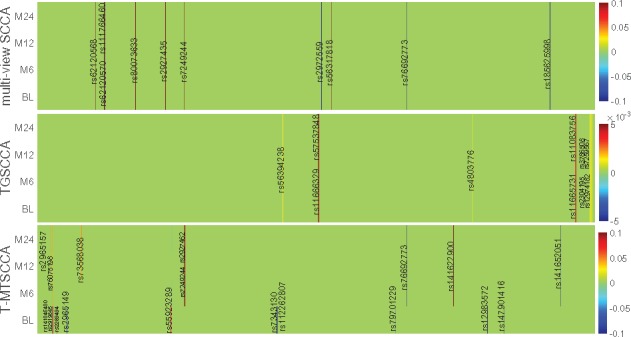
Fig. 4.

Comparison of canonical weights in terms of SNPs averaged from 10-fold cross-validation trials. Each row corresponds to a SCCA method: (1) mSCCA; (2) TGSCCA and (3) T-MTSCCA. For our method, there are four rows corresponding to four time points, i.e. BL, M6, M12 and M24. For mSCCA and TGSCCA, the four rows are stacked by the same u.
