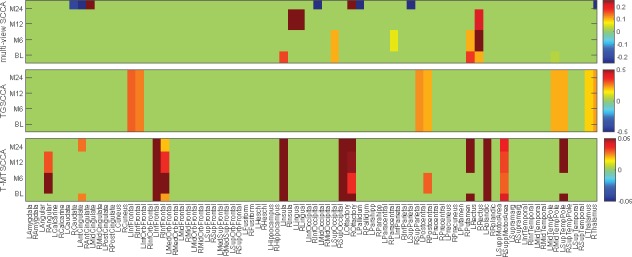
Fig. 5.

Comparison of canonical weights in terms of each imaging QTs averaged from 10-fold cross-validation trials. Each row corresponds to a SCCA method: (1) mSCCA; (2) TGSCCA and (3) T-MTSCCA. Within each panel, there are four rows corresponding to four time points of imaging QTs, i.e. BL, M6, M12 and M24.
